4.3. PDFs
While charts and dashboards are useful for exploration, most pricing teams still need formal reports – something you can share with underwriters, managers, or auditors. PDF reports are a common way to package results because they’re portable, fixed-format, and easy to distribute by email or archive for governance.
Python provides several ways to generate PDFs automatically. One of the most powerful is the ReportLab library, which gives you fine-grained control over document structure, layout, and styling. Unlike exporting static Excel or PowerPoint files, PDFs created in this way are fully reproducible, consistent across runs, and can be integrated directly into your pricing pipelines.
Why PDFs matter in pricing teams
- Auditability – The same code that produces your models can generate the exact report, ensuring transparency.
- Consistency – Instead of manually copying charts and tables, a single function can regenerate the full document every time the model updates.
- Flexibility – Mix text, tables, and charts in the same document, with control over page breaks, headings, and layout.
- Distribution – Produce a standardised pack for stakeholders (e.g. one report per rating factor), all with a single script.
Approach
In the example below, we combine Plotly charts and summary tables into a multi-page PDF. For each feature:
- A table is rendered to an image (using
gt-style tables). - A chart is exported from Plotly as a PNG.
- Both are inserted into a page with headings and spacing.
- A page break separates sections, producing one feature per page.
This workflow ensures that reports are consistent and version-controlled – when the model is retrained, rerunning the pipeline automatically regenerates the full PDF pack.
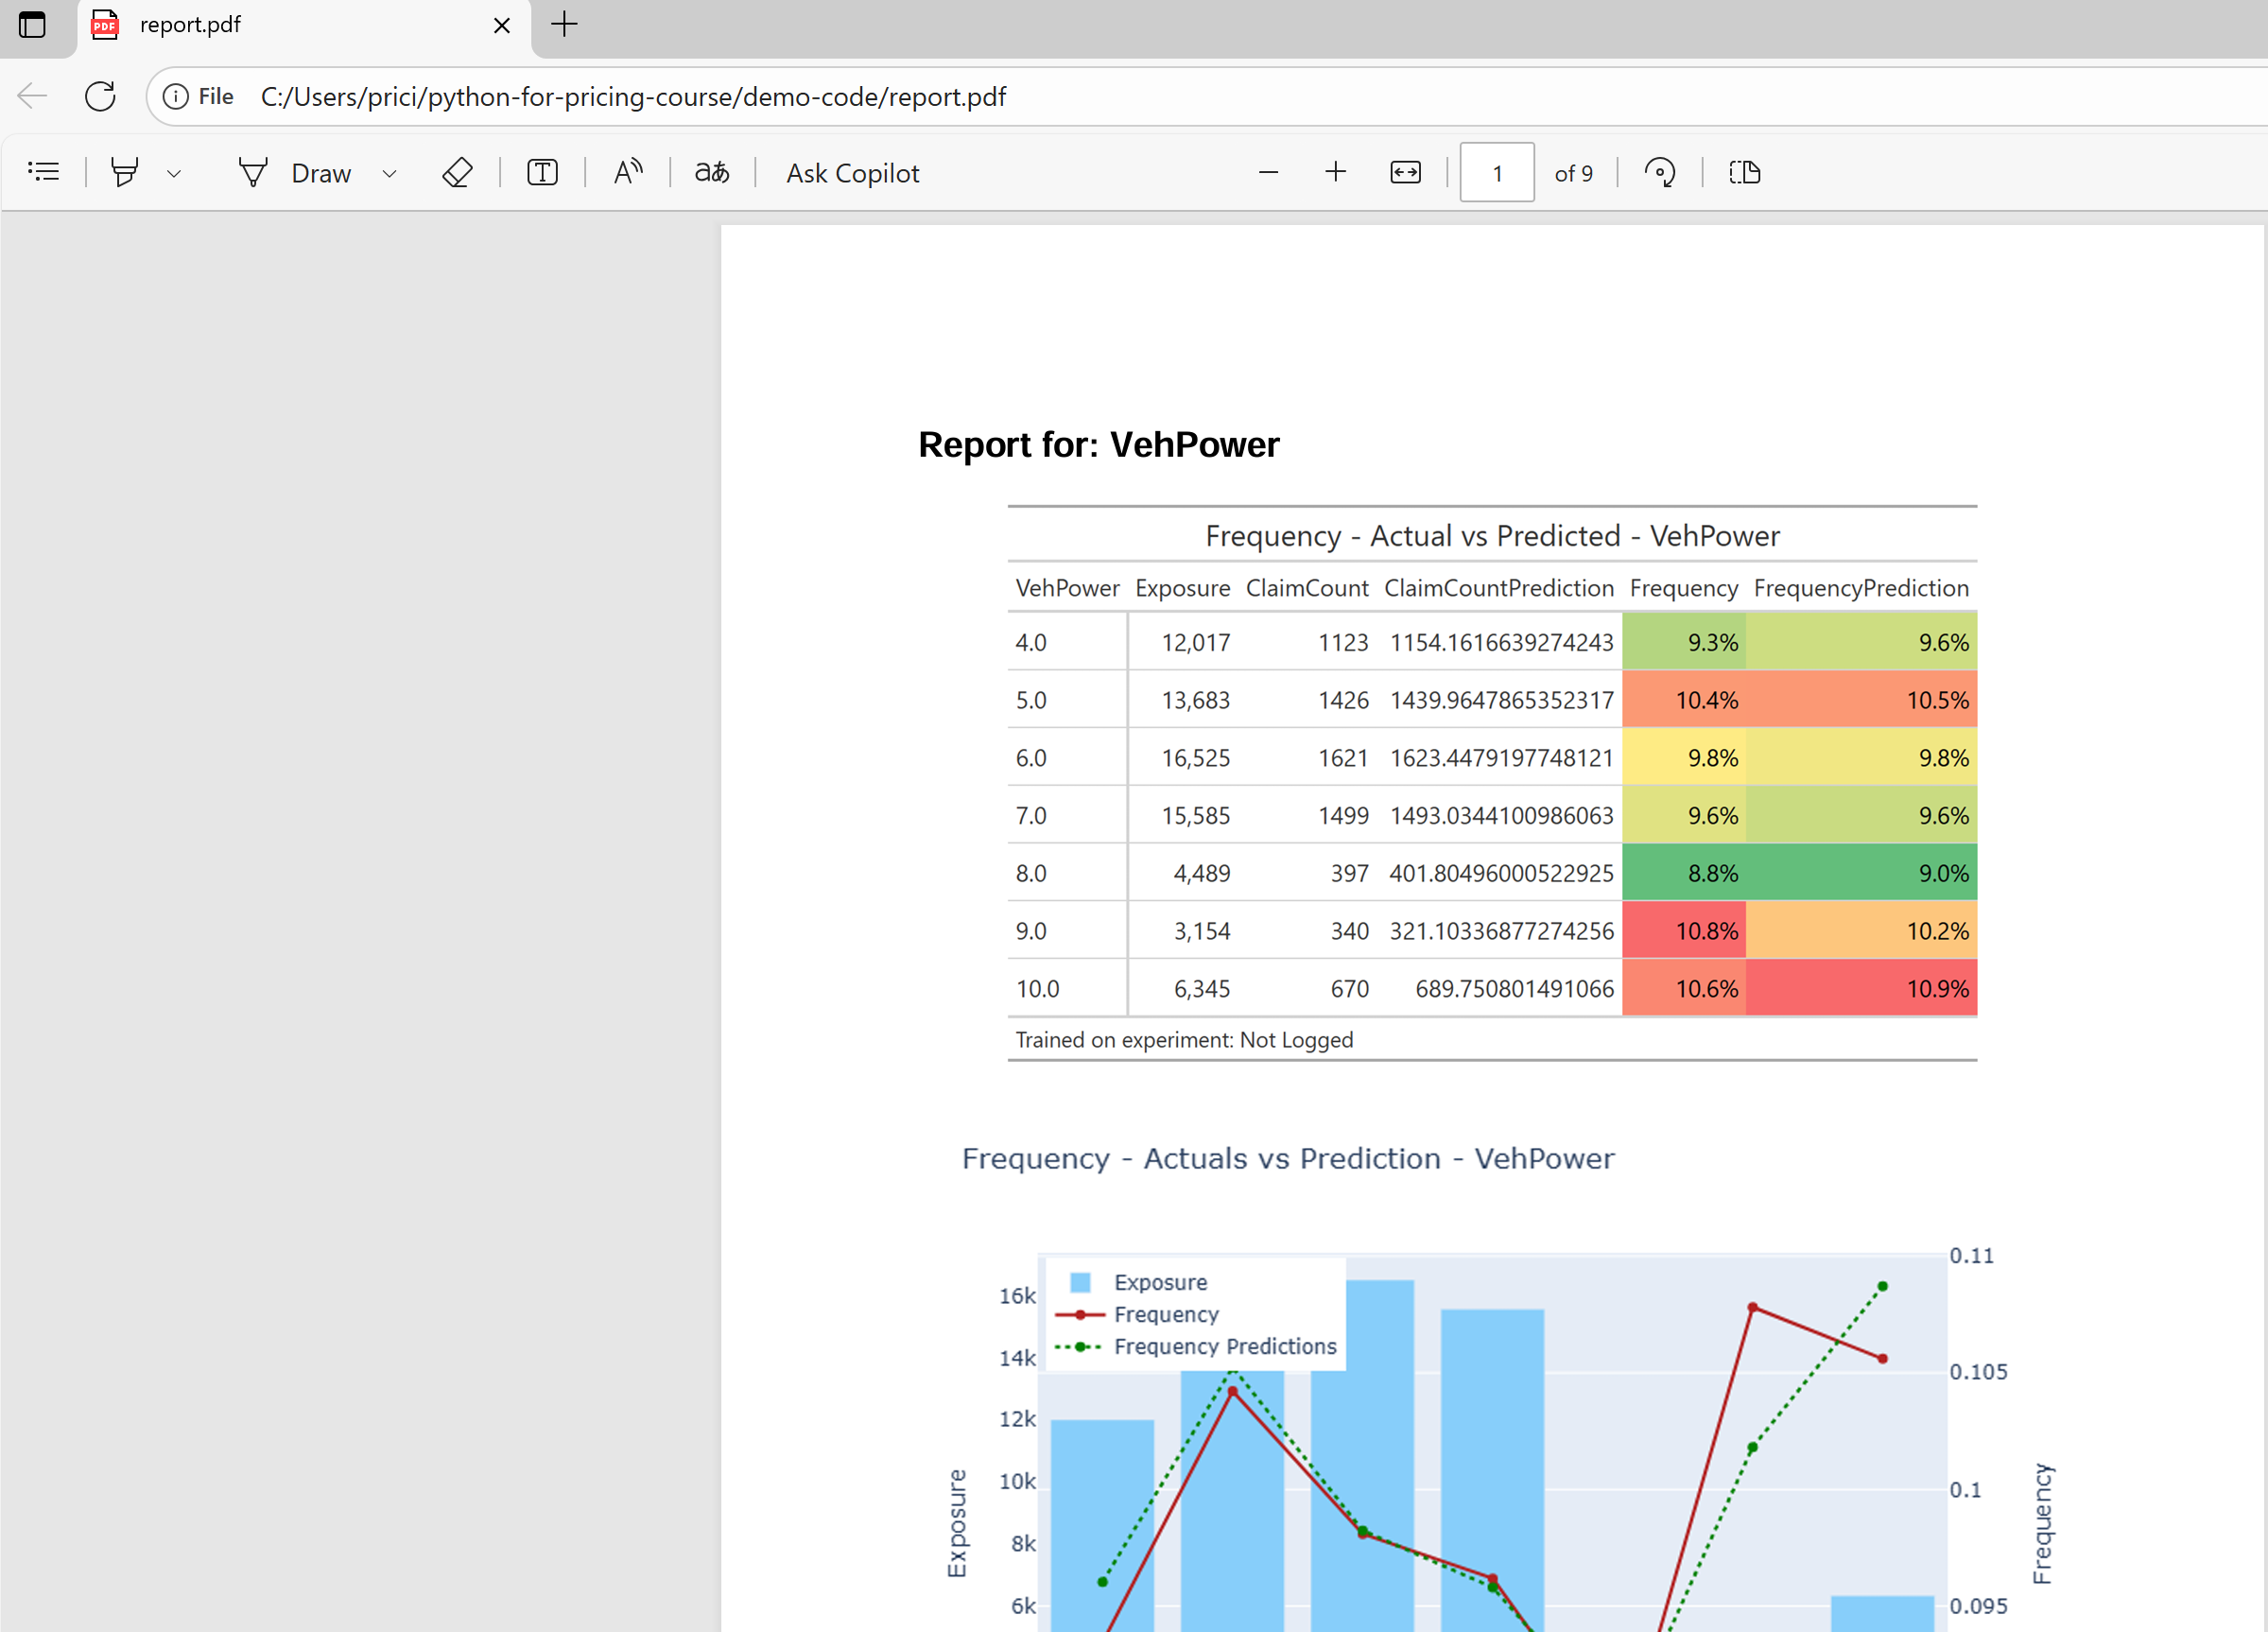
Example Output
The code creates a PDF with headings, tables, and charts:
from reportlab.platypus import SimpleDocTemplate, Image, Spacer, Paragraph, PageBreak, KeepTogether
from reportlab.lib.pagesizes import letter
from reportlab.lib.styles import getSampleStyleSheet
import io
import tempfile
import os
from PIL import Image as PILImage

# Page and margin configuration
PAGE_WIDTH, PAGE_HEIGHT = letter
TOP_MARGIN = 72
BOTTOM_MARGIN = 72
LEFT_MARGIN = 72
RIGHT_MARGIN = 72
AVAILABLE_HEIGHT = PAGE_HEIGHT - TOP_MARGIN - BOTTOM_MARGIN

# --- Helper: Save GT table to PNG in memory (Windows-safe) ---
def render_gt_table_as_image(gt_obj, scale=2.0):
    tmp_path = tempfile.mktemp(suffix=".png")
    try:
        gt_obj.save(tmp_path, scale=scale)
        with open(tmp_path, "rb") as f:
            buf = io.BytesIO(f.read())
        buf.seek(0)
    finally:
        if os.path.exists(tmp_path):
            os.remove(tmp_path)
    return buf

# --- Helper: Scale images proportionally ---
def get_scaled_image(buf, max_width, max_height):
    buf.seek(0)
    pil_img = PILImage.open(buf)
    orig_width, orig_height = pil_img.size

    scale = min(max_width / orig_width, max_height / orig_height)
    new_width = orig_width * scale
    new_height = orig_height * scale

    buf.seek(0)
    return Image(buf, width=new_width, height=new_height)

def generate_pdf_report(features, output_file="report.pdf"):
    doc = SimpleDocTemplate(
        output_file, pagesize=letter,
        topMargin=TOP_MARGIN, bottomMargin=BOTTOM_MARGIN,
        leftMargin=LEFT_MARGIN, rightMargin=RIGHT_MARGIN
    )
    elements = []
    styles = getSampleStyleSheet()

    image_max_width = PAGE_WIDTH - LEFT_MARGIN - RIGHT_MARGIN
    chart_max_height = AVAILABLE_HEIGHT * 0.6
    table_max_height = AVAILABLE_HEIGHT * 0.35  # small buffer

    for i, feature in enumerate(features):
        # --- Plotly chart ---
        aggregated_data = aggregate_frequency_df(holdout, feature, continuous_feature_config)
        fig_chart = plot_aggregated_data(
            visual_data=aggregated_data,
            feature=feature,
            target='Frequency',
            prediction='FrequencyPrediction',
            exposure='Exposure'
        )
        buf_chart = io.BytesIO()
        fig_chart.write_image(buf_chart, format="png")
        buf_chart.seek(0)
        img_chart = get_scaled_image(buf_chart, max_width=image_max_width, max_height=chart_max_height)

        # --- GT table ---
        gt_table = create_frequency_table(aggregated_data, feature=feature)
        buf_table = render_gt_table_as_image(gt_table, scale=2.0)
        img_table = get_scaled_image(buf_table, max_width=image_max_width, max_height=table_max_height)

        # --- Heading + table together (small, safe) ---
        elements.append(KeepTogether([
            Paragraph(f"Report for: {feature}", styles['Heading2']),
            Spacer(1, 6),
            img_table,
            Spacer(1, 6)
        ]))

        # --- Chart separately ---
        elements.append(img_chart)
        elements.append(Spacer(1, 6))

        # Page break after each feature except the last one
        if i < len(features) - 1:
            elements.append(PageBreak())

    doc.build(elements)
    print(f"PDF report saved to {output_file}")